Help with Marches
Your first map,
in a few minutes.
Start with a place you know. Add the dates, details, and evidence your research needs.
Make your first map
-
Find a place
In Find a place, type a name, check the result, and choose Add. Try a town, castle, church, or other landmark. Repeat for your next place. To explore first, choose Explore a sample on the welcome screen.
Already have a list? Open Import data and download the CSV template. Replace its example row with your own places and coordinates, then upload it.
-
Give it your details
Select a marker on the map or a name in the places list. You can change its name, symbol, color, and label position, and add a date, citation, or note. These changes belong to that place. Choose Done when you finish.
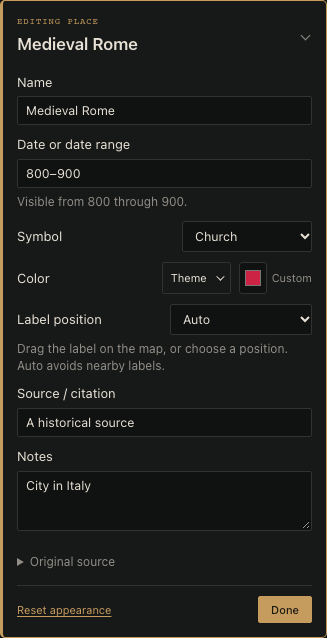
1 Add a year or a range. The sentence underneath explains when this place will appear.
2 Keep the source and your notes with the place.
Illustrative example. Select the screenshot to enlarge it.
-
Set the view and appearance
Drag the map to pan; pinch, scroll, or use + and − to zoom. Fit all brings everything back into view. Open Map appearance to choose a palette and label size. Drag any place label to move it.
Borders, shaded territories, and routes are optional. You can add them once your places are on the map.
-
Add time, if it helps your story
A date such as 1533 reveals a place from that year onward. Use 1533–1533 for an event that should appear only in that year. Press Play above the map, or open Years & captions to choose years and write captions. See the timeline walkthrough.
-
Save your work, then share your map
Save project downloads a file you can reopen in Marches. Keep this as your working copy. Export makes an image, playable map, or other output to share. For a first download, choose Image · PNG, check the preview, and choose Download.
When you need a hand
Common questions
Where is my map saved? Can I open it on another computer?
Marches automatically keeps your current project in this browser. That copy is local to the browser and device you are using; it does not sync to an account. Clearing browser data can remove it.
Choose Save project to download a file containing your places, borders, routes, dates, captions, and appearance settings. Keep it somewhere you can find it. On another computer, visit Marches and choose Open project to select that file.
Download a new copy after making changes you want to keep. Opening another project replaces the current map, so save the current one first. Exported images and web maps are for sharing; reopen the project file when you want to edit in Marches.
Why does a place keep appearing after its date?
A single place date means “from this year onward.” Choose a range when you want it to disappear again.
- 1533
- Appears in 1533 and every later year.
- 1533–1533
- Appears only in 1533.
- 1533–1536
- Appears from 1533 through 1536, including both end years.
- c. 1501
- Appears from 1501 onward. The approximate wording is retained, but playback changes at 1501.
- 50 BCE
- Dates before the common era are supported. There is no year zero.
- No date
- Appears in every year.
Select the place and edit Date or date range. The explanation beneath the field tells you how Marches reads it. An unreadable date leaves the place visible in every year and shows a warning.
Borders and routes have separate From and To fields; both end years count. Blank ends are open. A route’s dates apply to the whole route, independently of its places.
For a biographical map, decide whether you are showing accumulated associations or presence during a particular period. A single starting year does not establish that someone stayed at that place.
How do I get back to the whole map after playback?
Choose Show all years above the map. This stops playback, removes the year filter, and brings back every place, border, and route.
Fit all changes the view so everything fits on screen; it does not remove a year filter. In a downloaded interactive web map, uncheck Show one year to show everything.
How do I choose the years and add captions?
Choose Years & captions ↓ above the map. It opens the timeline controls below the map. Select Choose specific years to enter a list such as 1501, 1513, 1533, 1536, or keep When the map changes to use changes in your dated places, borders, and routes.
Select one of the year buttons, then write in Caption for…. Captions appear with that year in playback and exports. Playback options controls the pause at each year and whether playback repeats. Each step has the same duration, even when the years are far apart.
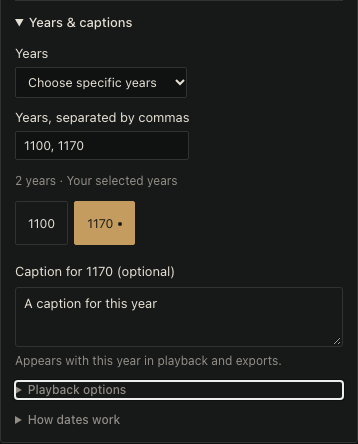
1 Select a year.
2 Write its caption.
These same years are used for comparison grids and image series.
Select the screenshot to enlarge it.
Choose At regular intervals for evenly spaced years; set Years between steps under Playback options. You can also turn on Mark changes or Show timeline strip.
How do I move a label or change just one marker?
Drag the label on the map. Or select its place and choose Label position in the left panel. Choose Auto to return to automatic placement. A fine connector helps identify the marker when its label needs to sit farther away.
The selected place’s Symbol and Color controls affect only that place. Use Map appearance for the overall palette, label size, and geographic features.
Can a shaded territory follow the coast or have no outline?
Choose Shade a territory, then click or tap around its edges. Add at least three points and choose Finish. In its editor, choose a shading style and strength. Uncheck Show outline for shading alone.
To follow the coast, select the territory and choose Follow coastline…. Pick two existing points on its border to mark the ends of the stretch. Check the preview, then choose Apply coastline. You can replace a whole stretch at once.
Hatching and Engraved edge are appearance options. Engraved edge adds decorative strokes inside the edge; it does not represent terrain. Coastline tracing uses modern Natural Earth geometry, so check it against your historical sources.
Certainty records your assessment of the evidence. Marches suggests solid for attested, dashed for approximate, and dotted for conjectural borders. You can change these under Fine-tune appearance; the choices are not a universal scholarly convention.
How do I finish a drawing or connect places as a route?
While drawing, choose Finish above the map. A border line needs at least two points; a territory needs three. Undo point removes the last point, and Cancel abandons the unfinished drawing. On a keyboard, Enter finishes and Escape cancels.
For a journey, add the places first, open Routes, and choose Create route. Select the places in travel order, then choose Done. Routes join stops schematically; they do not reconstruct a historical road.
Which download should I choose?
For future editing in Marches, use Save project. For a finished output, open Export:
- Image · PNG
- A picture for documents, slides, print, or social posts.
- Editable graphic · SVG
- A scalable figure for a graphics editor. Keep the project file too if you want to reopen the map in Marches.
- Interactive map · HTML
- One file that opens in a browser, with pan, zoom, place details, and playback. It includes every year and works offline.
- Video · MP4
- A vertical video for Stories and Reels, with dated chapters, captions, close-up views, and optional title and closing cards. Make a video →
- Compare years · PNG grid
- Several dated maps side by side in one image, at the same scale. Useful for a paper or a slide.
- Image series · ZIP of PNGs
- One image for each selected year, with its year label and any caption. Useful for a slide sequence or carousel.
- GIS data · GeoJSON
- Places, borders, and routes with their dates and sources, for mapping software.
PNG and SVG show the current view and year. Choose Show all years first for a complete static map. For a grid or image series, use Years & captions to choose the years.
Image shape offers square, portrait, story, and landscape formats; the preview shows the fit. Choose Video · MP4 for a video to upload, or Interactive map · HTML for a map readers can pan, zoom, and play in a browser.
How do I make an Instagram Story or Reel?
Add dates and choose your years under Years & captions, then open Export → Video · MP4 → Make a video. Everything is made on your device; no account or upload is needed.
- Give the video a title. Keep Short Story for a clip up to 58 seconds, or choose Reading pace for longer captions.
- Preview each year. Its Video caption starts with your map caption; shorten it here without changing the fuller caption in the map.
- Follow featured places makes closer views, with two panels for widely separated places. Automatic selection uses places that appear since the previous year. Open Choose featured places when a chapter concerns an existing place. Clear the choices to show the whole map, or choose Keep current map view for consistent framing throughout.
- Optionally add an opening title card and your own closing message. Play the preview, then select Create MP4 and Download MP4. On supported phones, Save or share video opens the device’s sharing choices.
The video is vertical, 1080 × 1920 pixels, with a 720 × 1280 fallback if your browser needs it. It has no audio; add music, narration, or a link sticker in Instagram. Making a video does not post it anywhere. Marches branding and credits are optional.
Use a current browser with MP4 encoding, such as Chrome or Safari. If export is unavailable, try another browser or download an image series. Videos support up to 60 selected years and three minutes; a short Story holds each year for at least 2.5 seconds. Long captions ask you to shorten them instead of cutting off your words. Dates, view choices, and short video captions save in your project.
What if search cannot find my place?
Search uses Wikidata. Try a modern name, an alternative spelling, or the wider town or area, and check the result’s description before adding it. Some entries have no coordinates and cannot be added.
You can rename an added place to match your sources. If the location is missing, put its coordinates in the CSV template and import it. Place name, latitude, and longitude are required; date, source, category, and notes are optional.
A new CSV replaces previously imported places, while places added through search remain. Save your project before replacing a list you want to keep. Review imported columns lets you revisit the column choices after import.
Are these historical coastlines? Do I need to give credit?
The base map uses modern Natural Earth coastlines and physical geography. Place search also supplies modern reference locations. Neither establishes the geography or boundaries of your period; use your evidence to assess them.
Natural Earth data is public domain. Its terms allow publication and commercial use without permission or credit. If you would like to acknowledge it, Copy credit in Export supplies an optional credit.
You do not need to credit Marches. Cite your research sources as appropriate, and check the terms of any other data you import.
Who can see my map and search data?
Your project is processed and saved in your browser. Marches does not upload it to a project account. Place-search text is sent to Wikidata as you type.
With your permission, Google Analytics measures site visits and feature use. Map contents, uploaded files, and search text are not sent to Google Analytics. You can change your choice through Analytics settings in the footer.
Exported maps contain no analytics. Interactive HTML and GeoJSON exports include place details and source notes, so check them before sharing.